What is filtering?
Applying a filter to your Dashboard allows you to view/report on a subset of your data. For instance, you may want to view results from a specific time period or from respondents in a certain location. Filters can be applied to an entire Dashboard, in which case all Dashboard charts/graphs will be filtered, or they can be applied to an individual chart or graph. There are two types of Dashboard Filters - static filters and live filters.
- Static filters are applied to a Dashboard and saved - they will remain there until deleted.
- Live filters are meant to be more interactive so you can change them to look at different cuts of data at any time. Live filters are not saved - they are reset whenever you refresh or re-run the report. Printed or exported dashboards will also not include live filters - you should use static filters for printing or exporting.
**This guide assumes that you have already created a Dashboard and are ready to add filters to it. If you need help creating your Dashboard, please review our "How to Create a Custom Dashboard" guide.**
Apply a Static Filter to an entire Dashboard
1. Edit your Dashboard and click the Add Dashboard Filters button
2. Click Add Filter and choose your Filter source and options:
- Question: Filter your results based on the answer to a particular survey question. For instance, you might want to run a report for all respondents who answered that they were male or of a certain age range in a demographic survey. * Note that if your Dashboard includes charts for multiple surveys, setting a filter based on the answer to a question will only apply to the survey that contains that question.
- Contact Attribute: Filter your results based on information that's stored in your respondent's contact profile, such as their age, geographic location, or department. * Note that your survey respondents must exist as Contacts in Checkbox for this filter option to work.
- Response Property: Filter your results based on something about your survey responses, such as the language the survey was taken in.
- Date Range: Filter your results based on date of the response. * Note that the date range is based on the completion date of the survey.

3. Add any additional filters that you'd like apply to your Dashboard.
Note that when you add multiple filters to a Dashboard they are "AND" filters. This means that you will only see results where both filters are true. For example, if you apply two question filters "What's your favorite ice cream is equal to chocolate" and "What's your favorite topping is equal to hot fudge", your Dashboard will only display the responses where someone answered both "chocolate" and "hot fudge."
4. View your Filtered your Dashboard
Click on the Overview tab of your Dashboard to see your filtered results. Note that the applied static filters are not displayed anywhere on your Dashboard, so we recommend naming your dashboard something that will indicate what filters are applied to it. 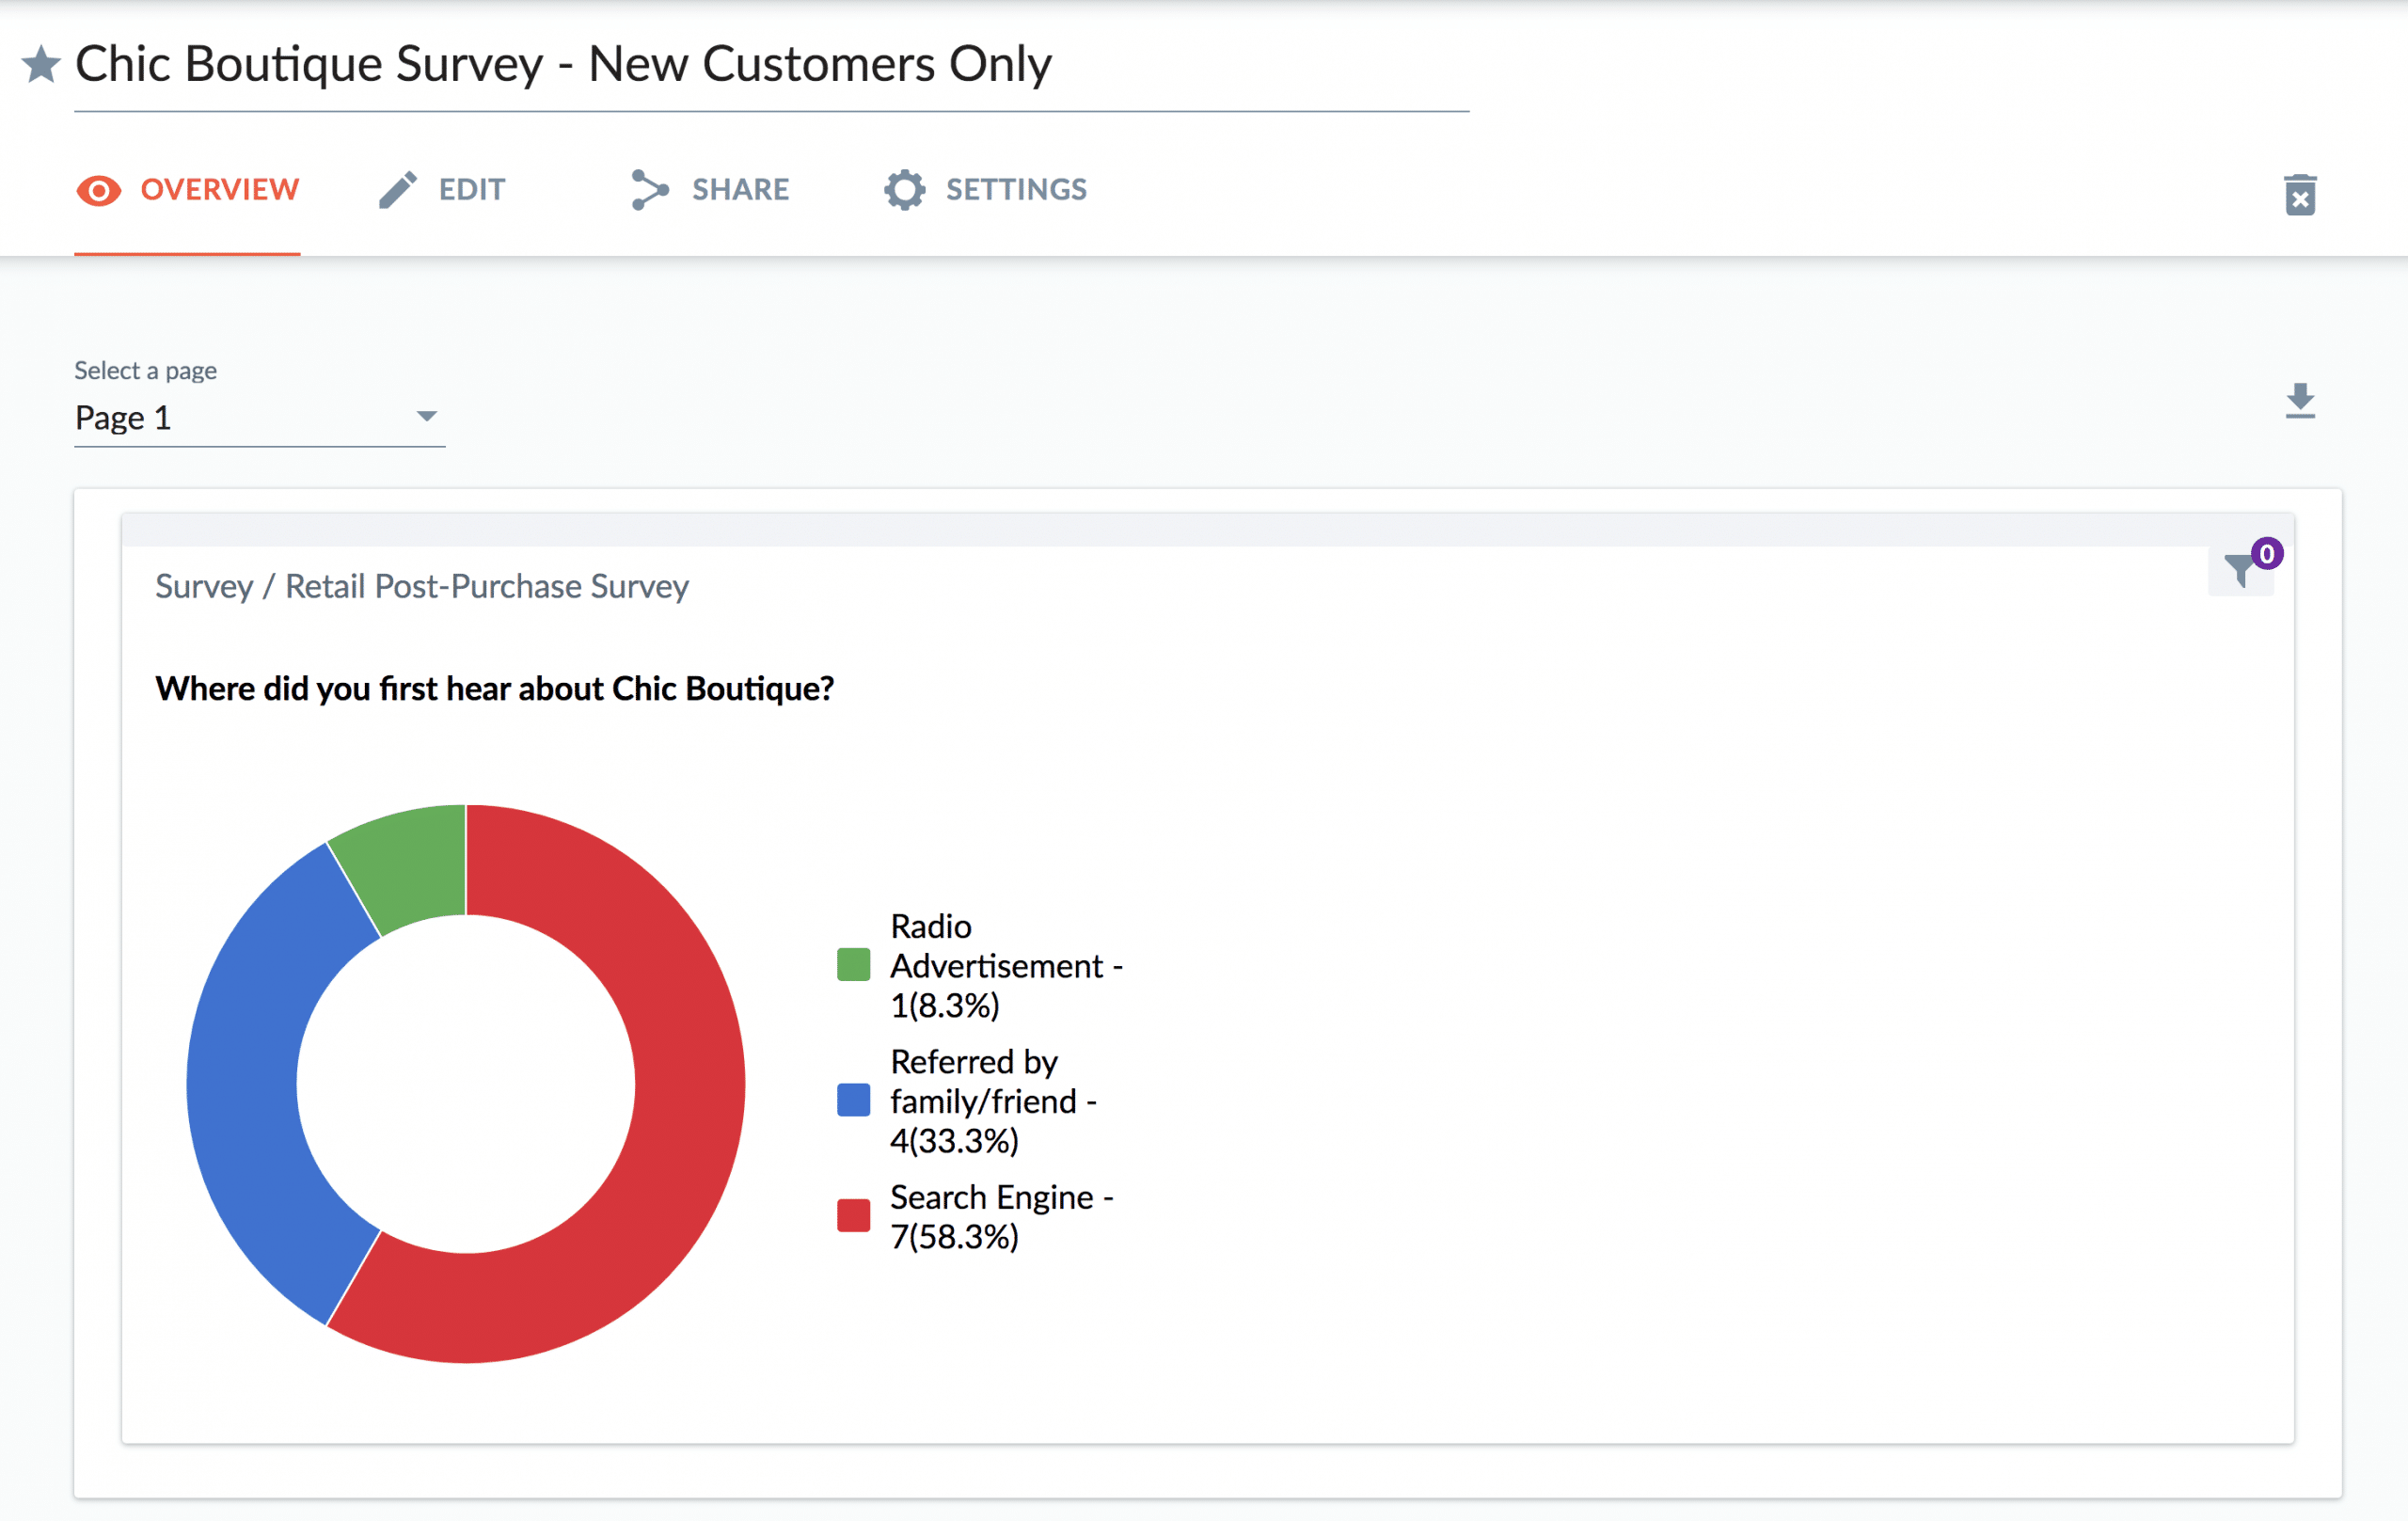
Apply a Static Filter to a chart
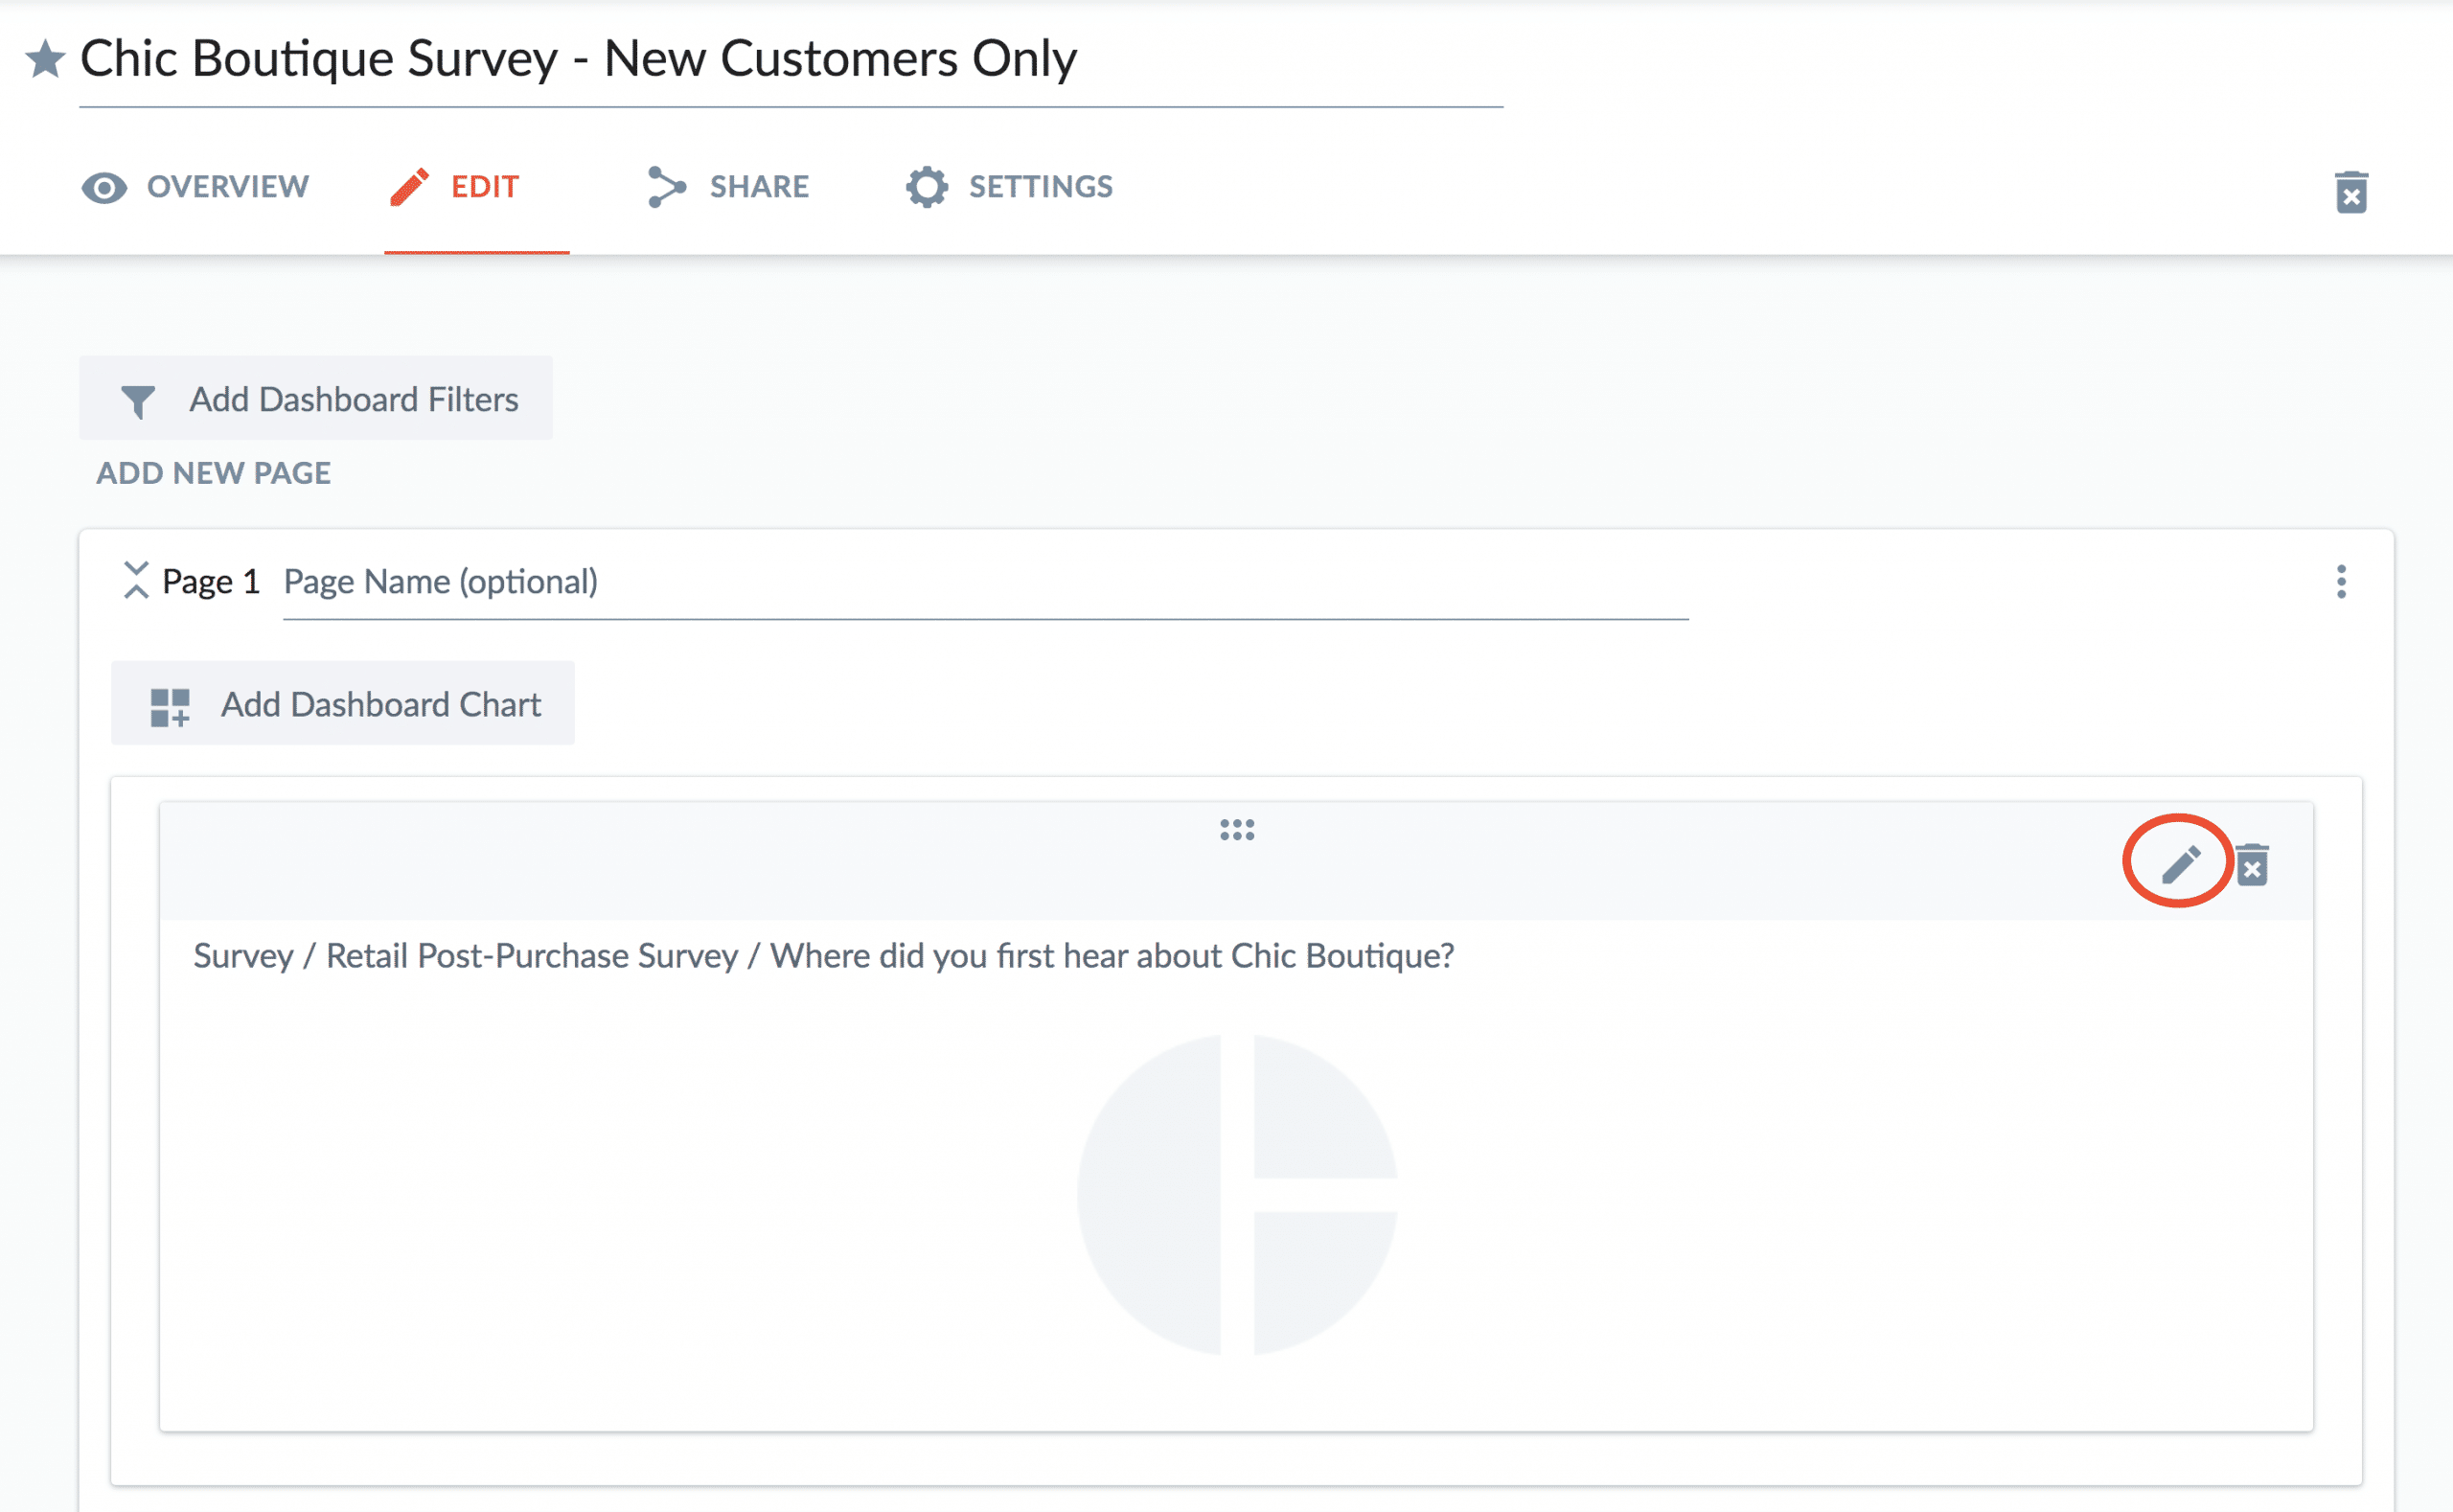
1. Edit your Dashboard and then edit the chart you want to apply your filter to
2. Click Add Filter and choose your Filter source and options:
- Question: Filter your results based on the answer to a particular survey question. For instance, you might want to run a report for all respondents who answered that they were male or of a certain age range in a demographic survey.
- Contact Attribute: Filter your results based on information that's stored in your respondent's contact profile, such as their age, geographic location, or department. * Note that your survey respondents must exist as Contacts in Checkbox for this filter option to work.
- Response Property: Filter your results based on something about your survey responses, such as the language the survey was taken in.
- Date Range: Filter your results based on date of the response. * Note that the date range is based on the completion date of the survey.

3. Add any additional filters that you'd like apply to your Dashboard.
Note that when you add multiple filters to a Dashboard they are "AND" filters. This means that you will only see results where both filters are true.
4. View your Filtered your Dashboard
Click on the Overview tab of your Dashboard to see your filtered results. Note that the applied static filters are not displayed anywhere on your Dashboard, so we recommend naming your dashboard something that will indicate what filters are applied to it. 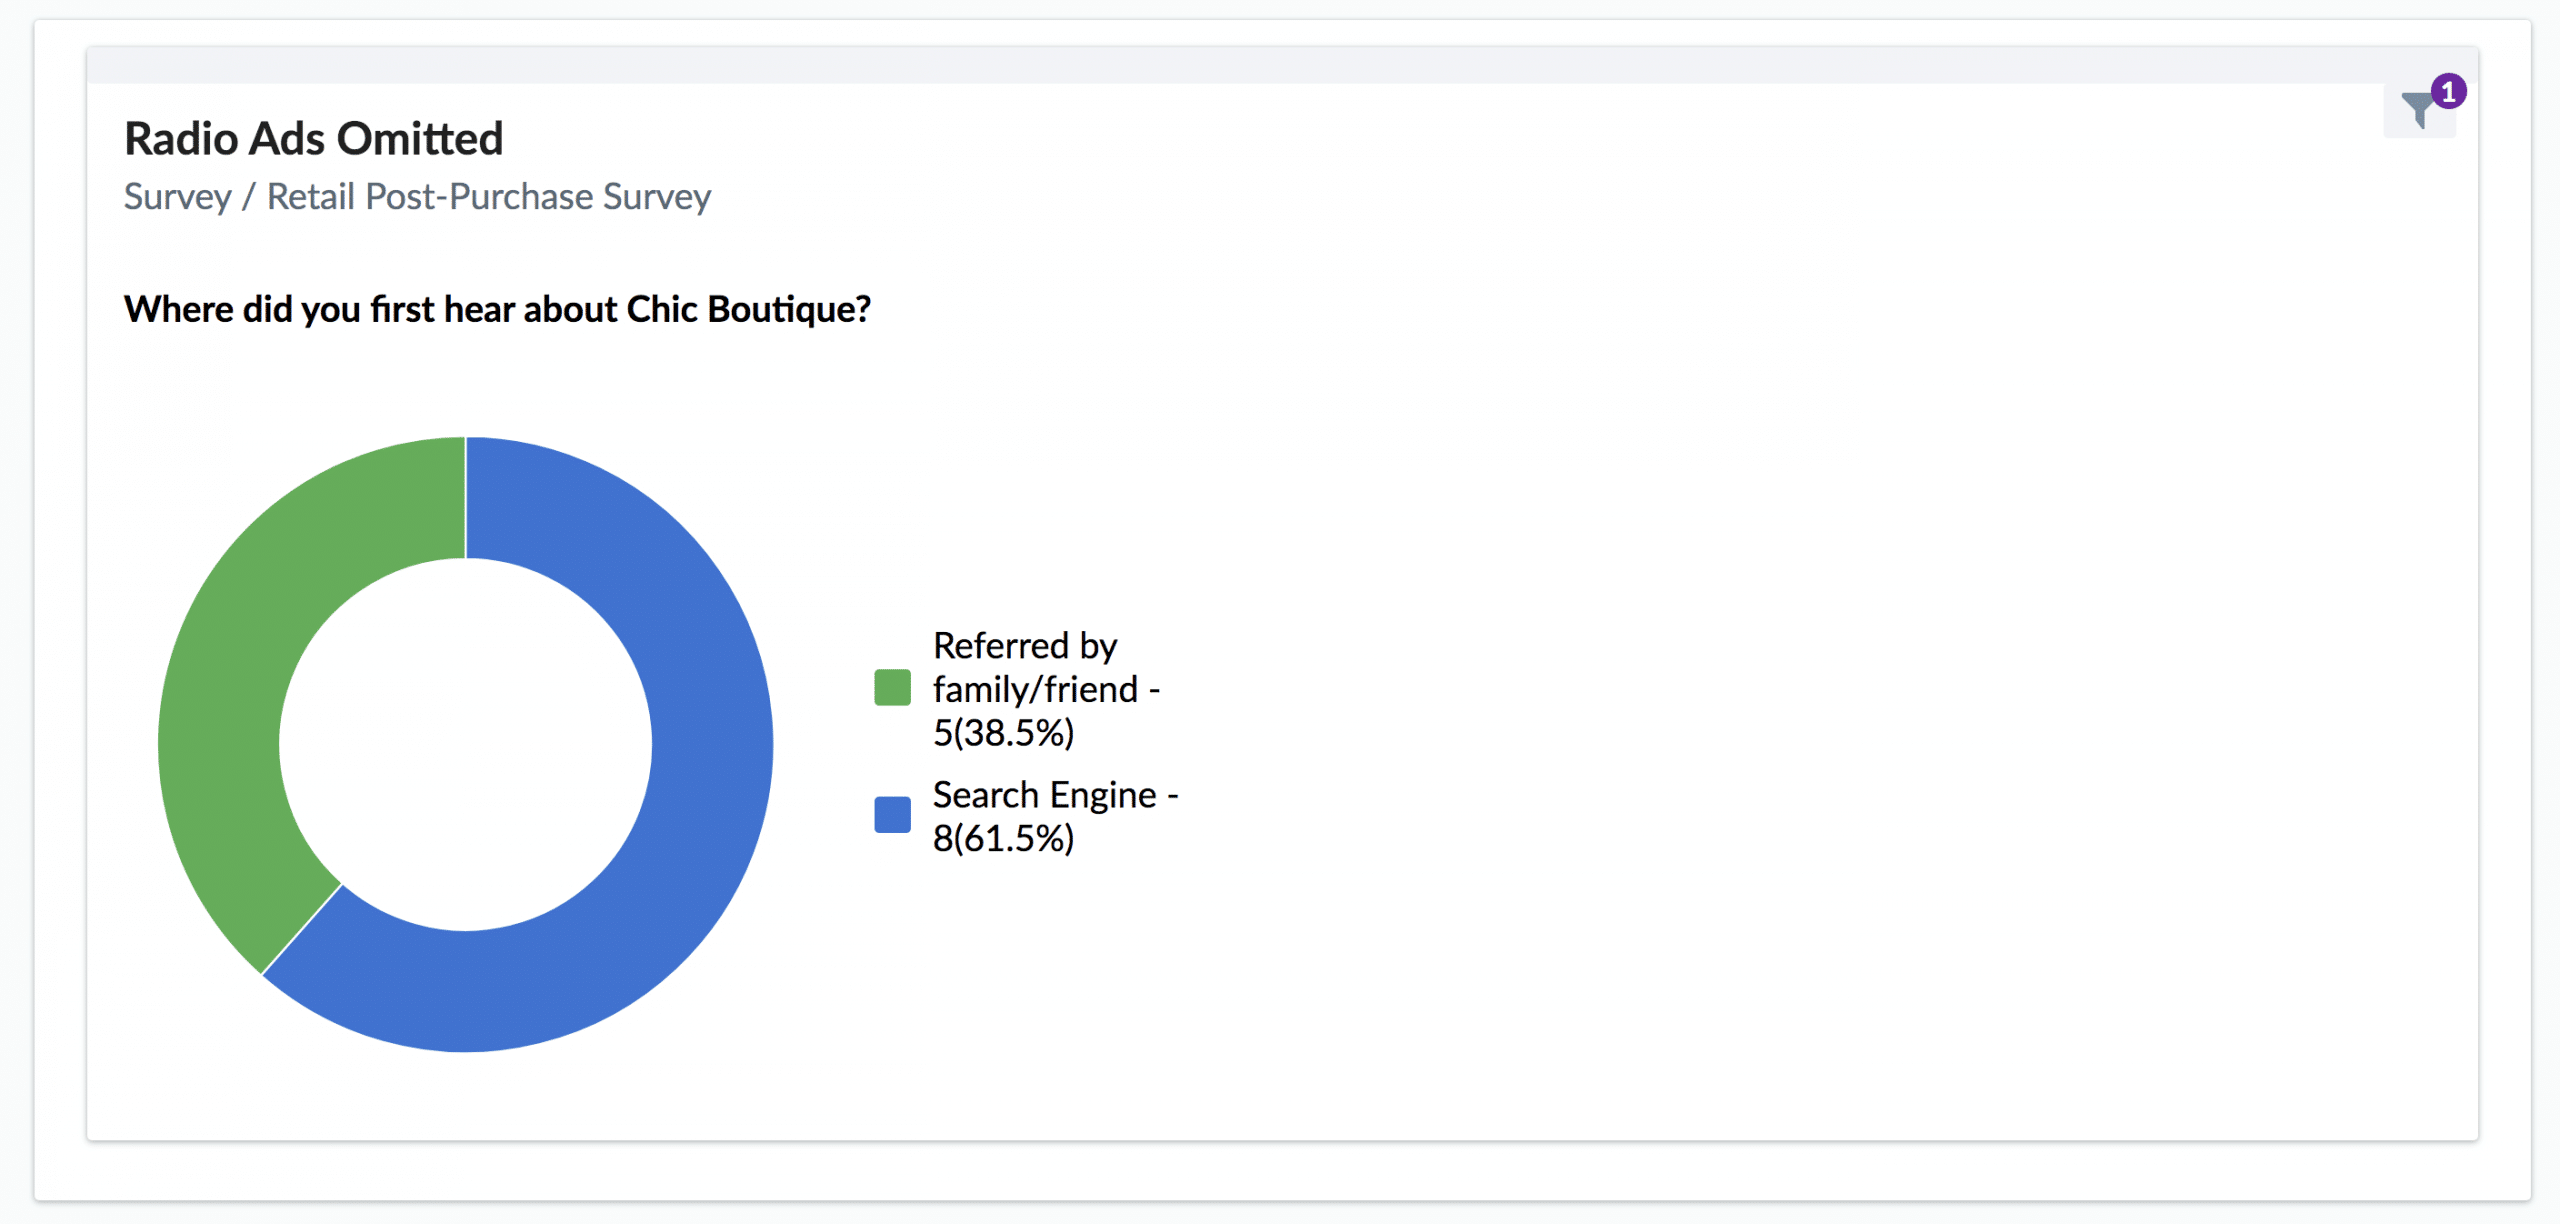
Apply a Live Filter to a chart
1. Create your Dashboard and go to the Overview tab to view your results
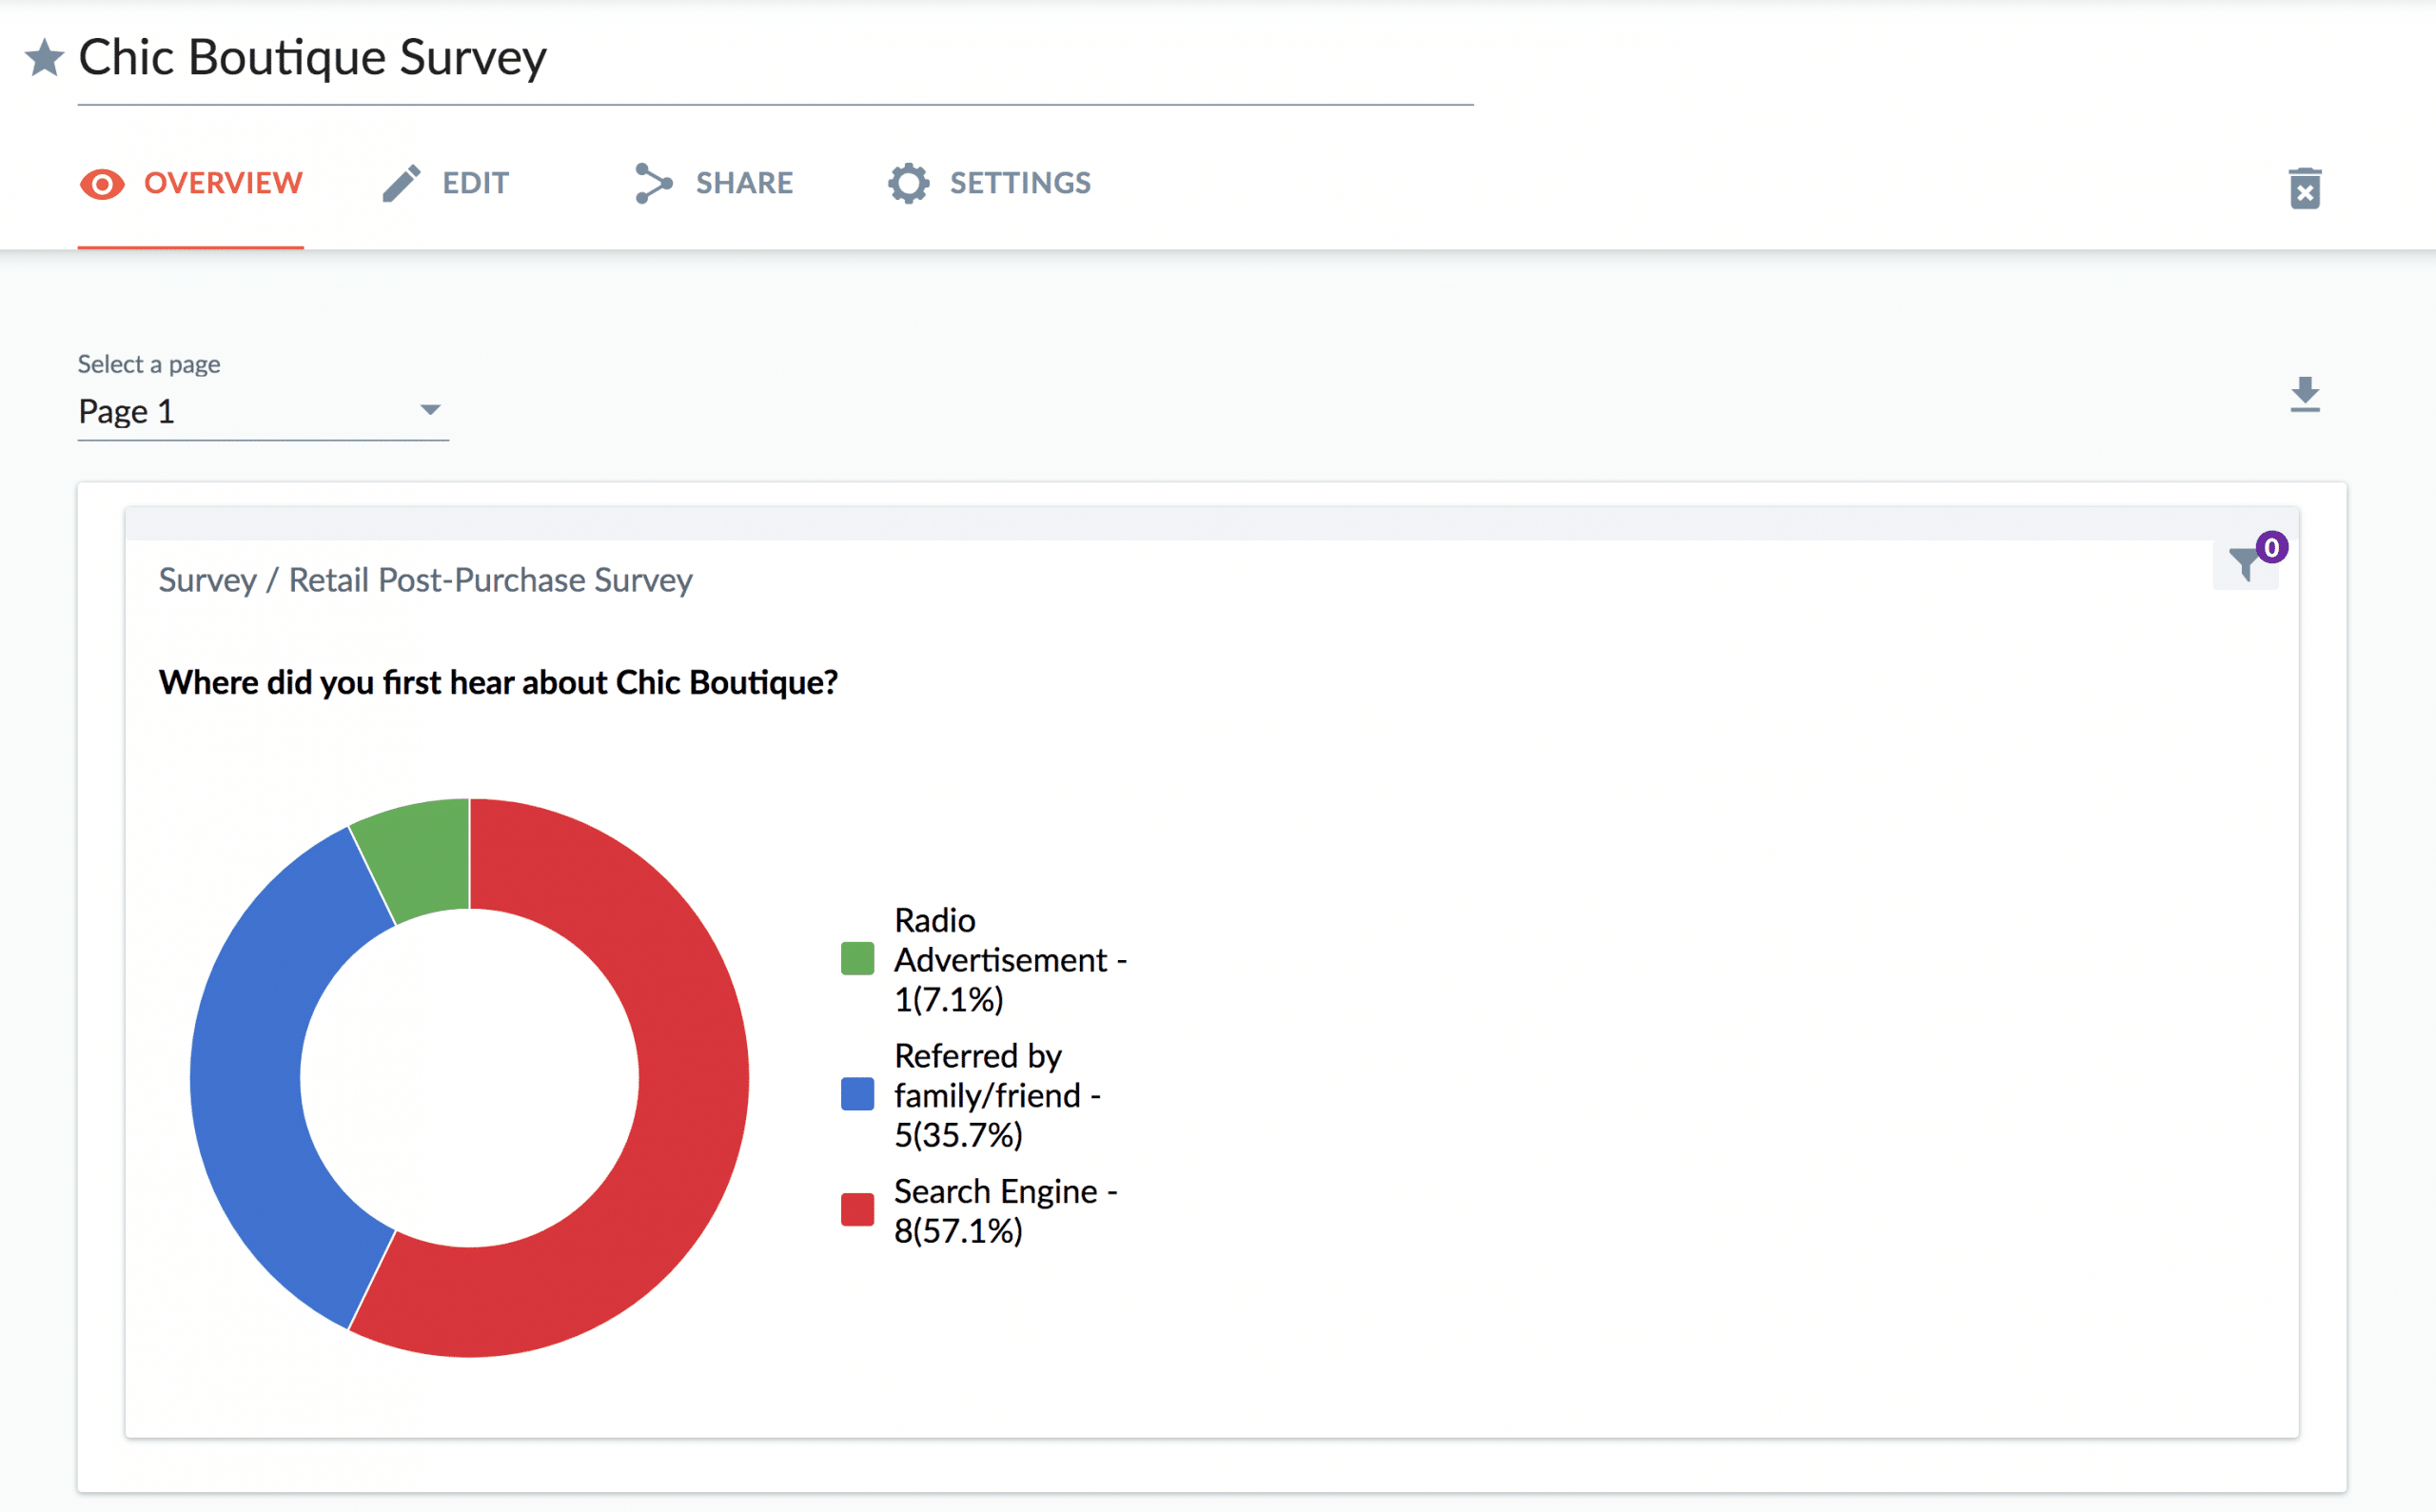
2. Click the filter icon and then click edit

3. Choose your Filter source and options:
- Question: Filter your results based on the answer to a particular survey question. For instance, you might want to run a report for all respondents who answered that they were male or of a certain age range in a demographic survey. * Note that if your Dashboard includes charts for multiple surveys, setting a filter based on the answer to a question will only apply to the survey that contains that question.
- Contact Attribute: Filter your results based on information that's stored in your respondent's contact profile, such as their age, geographic location, or department. * Note that your survey respondents must exist as Contacts in Checkbox for this filter option to work.
- Response Property: Filter your results based on something about your survey responses, such as the language the survey was taken in.
- Date Range: Filter your results based on date of the response. * Note that the date range is based on the completion date of the survey.

4. View your filtered results on the Overview tab.
*Note that Live Filters will be removed each time you re-run or refresh the survey or when you print or export the survey. They are meant to be interactive so you can view different segments of your data "on the fly". 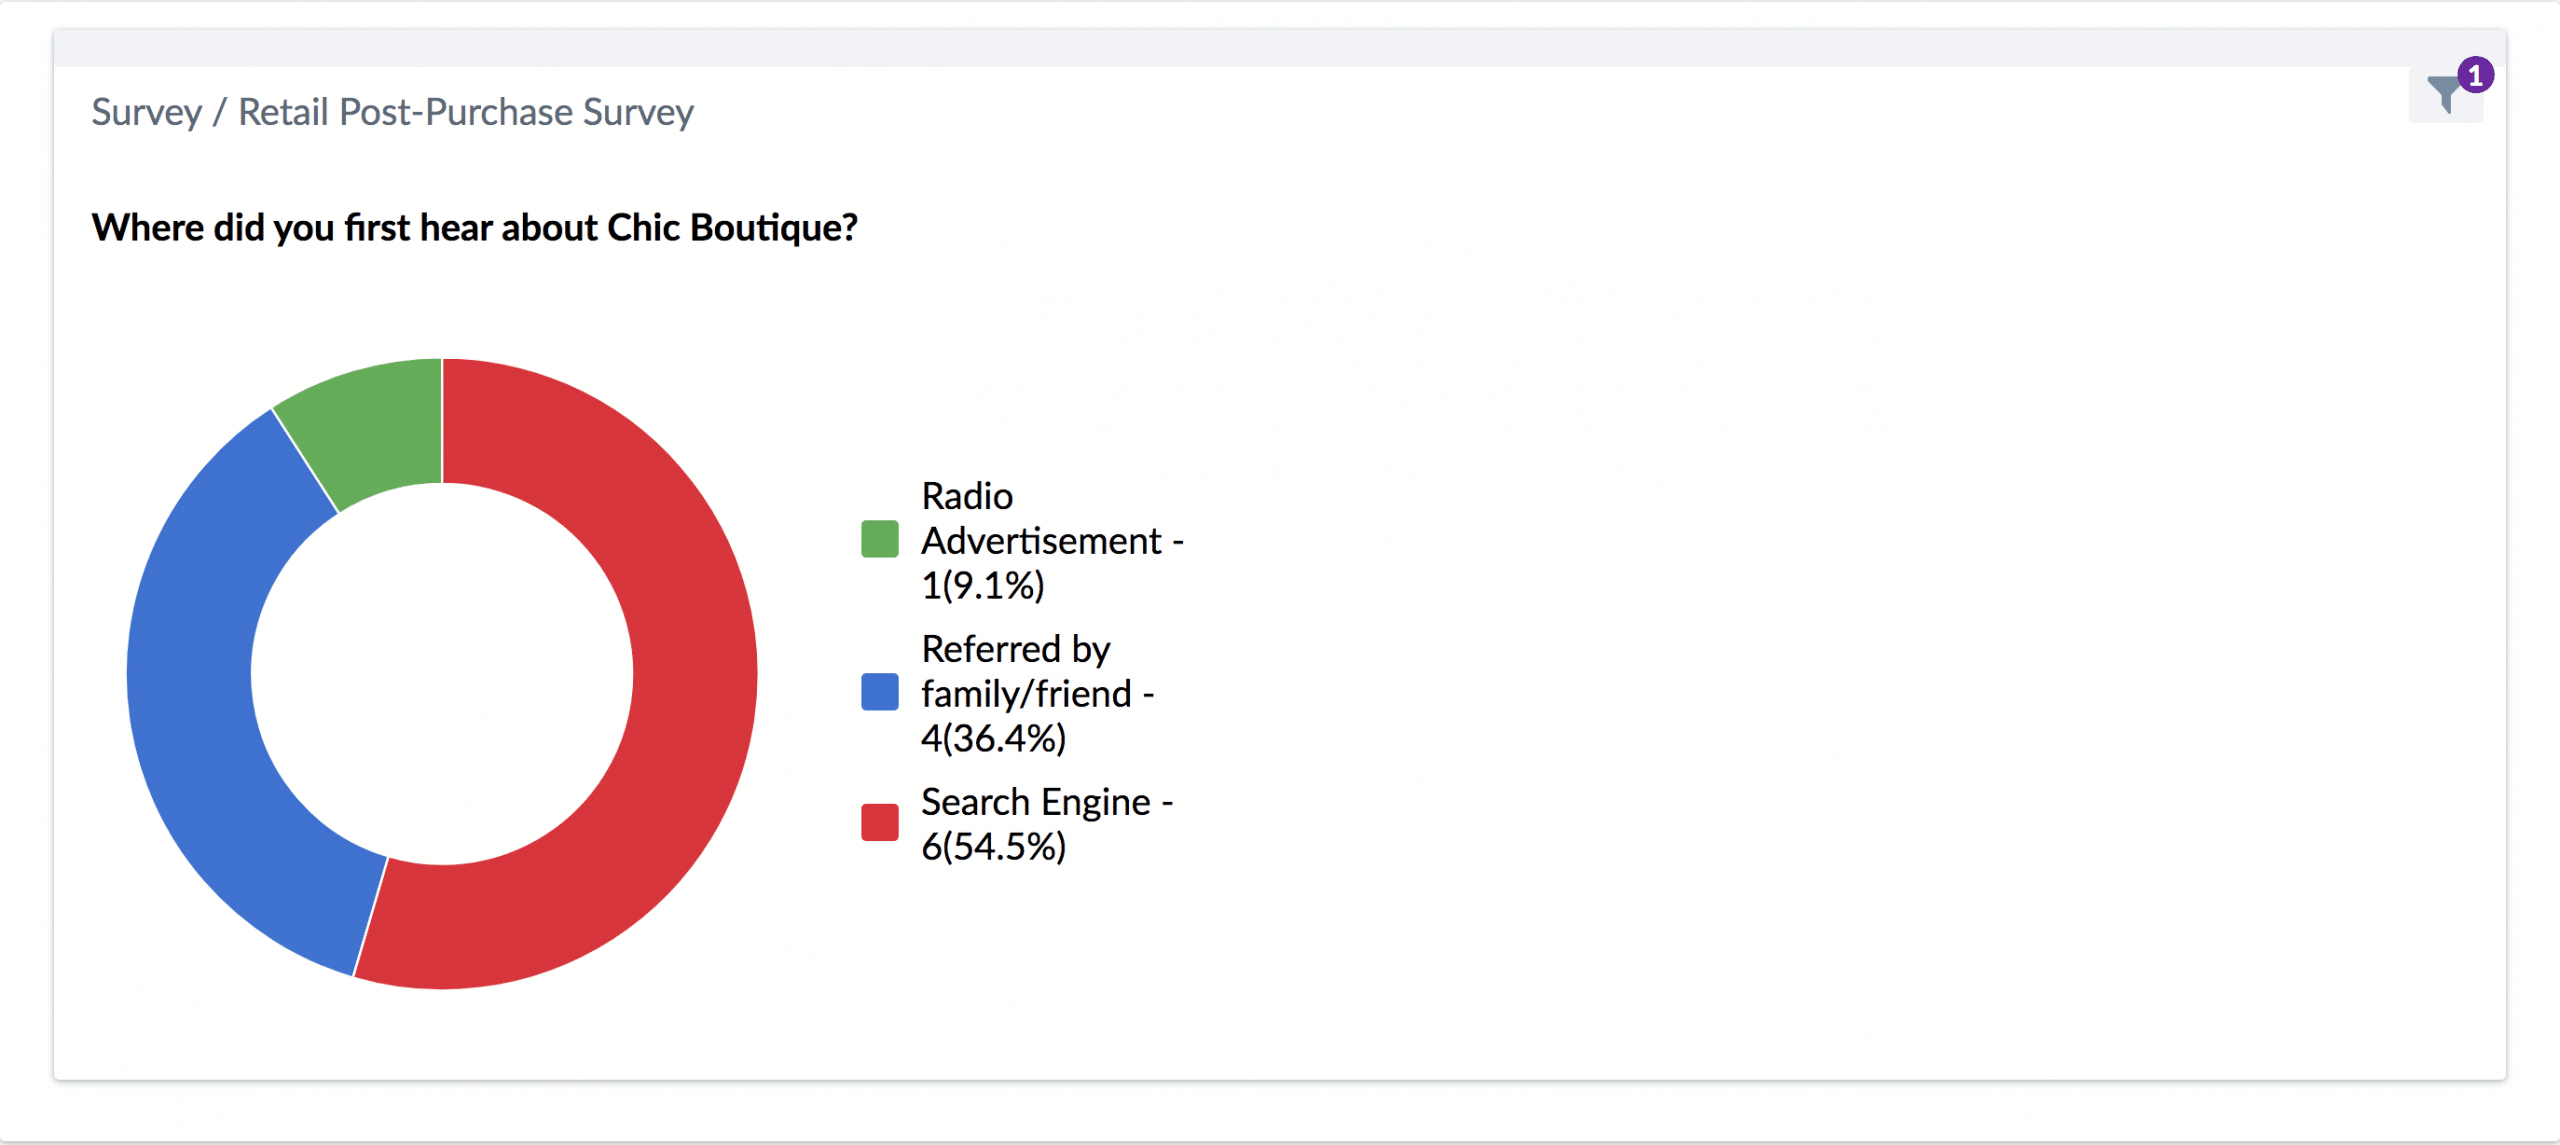


0 Comments