What is a Dashboard and how is it different from a report?
A Dashboard is a custom report based on survey data. We call it a Dashboard, rather than a report, because you can include charts from multiple surveys in a single Dashboard. Also, because you can apply live filters and interact with your data in a more dynamic, at-a-glance way. Dashboards are a little different from the standard Report that is included for each survey. The Report tab for your survey includes charts/graphs for each question of your survey - these are automatically generated based on system defaults and only include minor customization options. Dashboards, on the other hand, are created by you - they need to be built chart by chart, in much the same way that you build a survey. While it's a little more work to create a custom Dashboard, the upside is that you do have more charts to choose from and you have additional options such as filters that you can apply. Dashboards can include charts for all survey questions or just a select few - this is up to you. Just like the standard Report, Dashboards present live data each time they are run or refreshed, can be exported to PDF, and can be shared via private or login-protected link.
How to Create a Dashboard
1. Click on the main Dashboards menu in your account

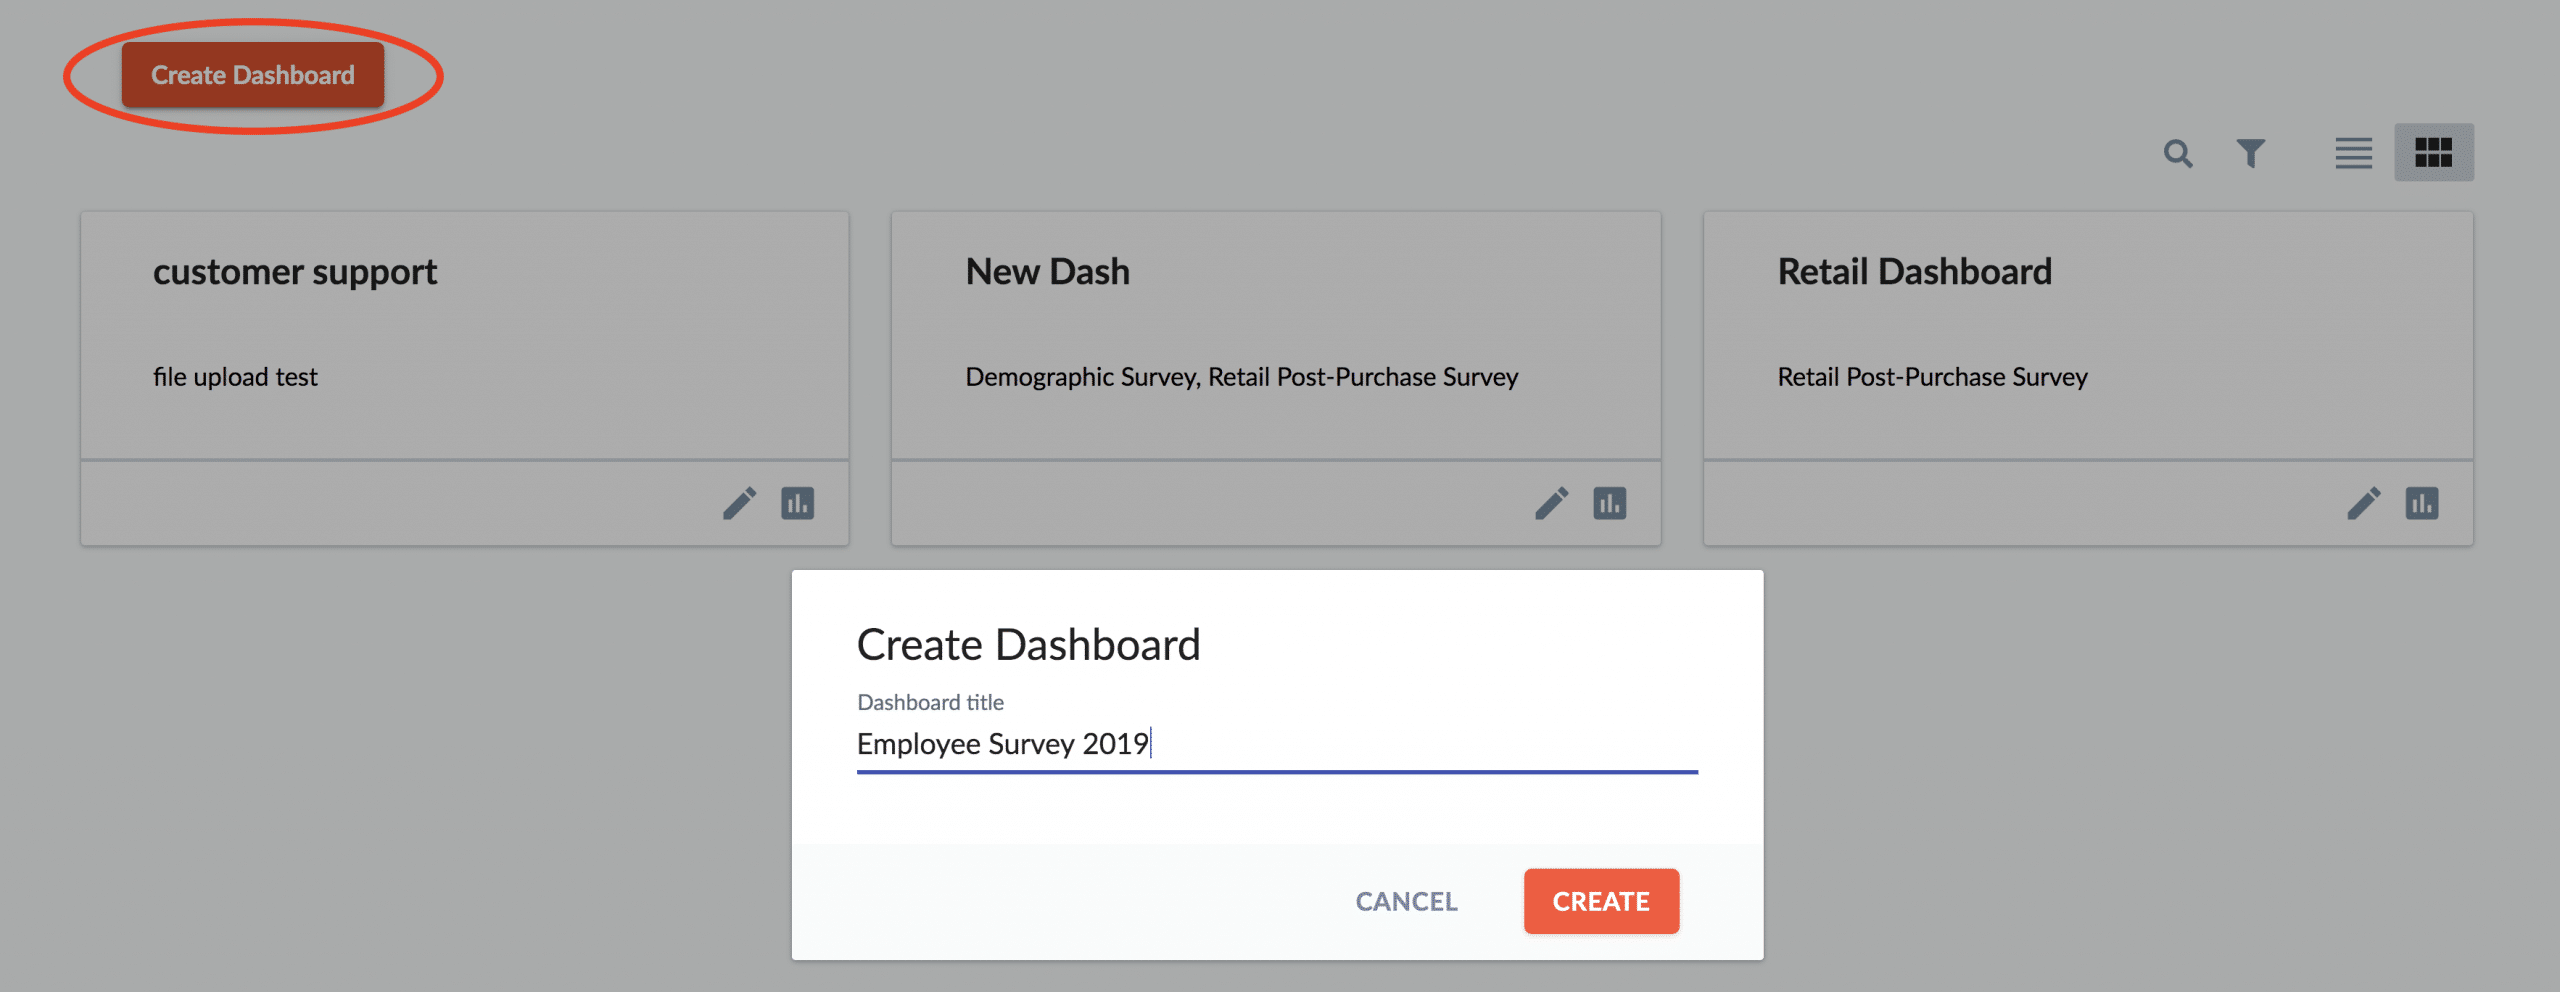
2. Click Create Dashboard and give your Dashboard a name
The name can be the name of the survey or something else - whatever will help you identify it. 
3. Click Add Dashboard Chart to start to build your Dashboard.

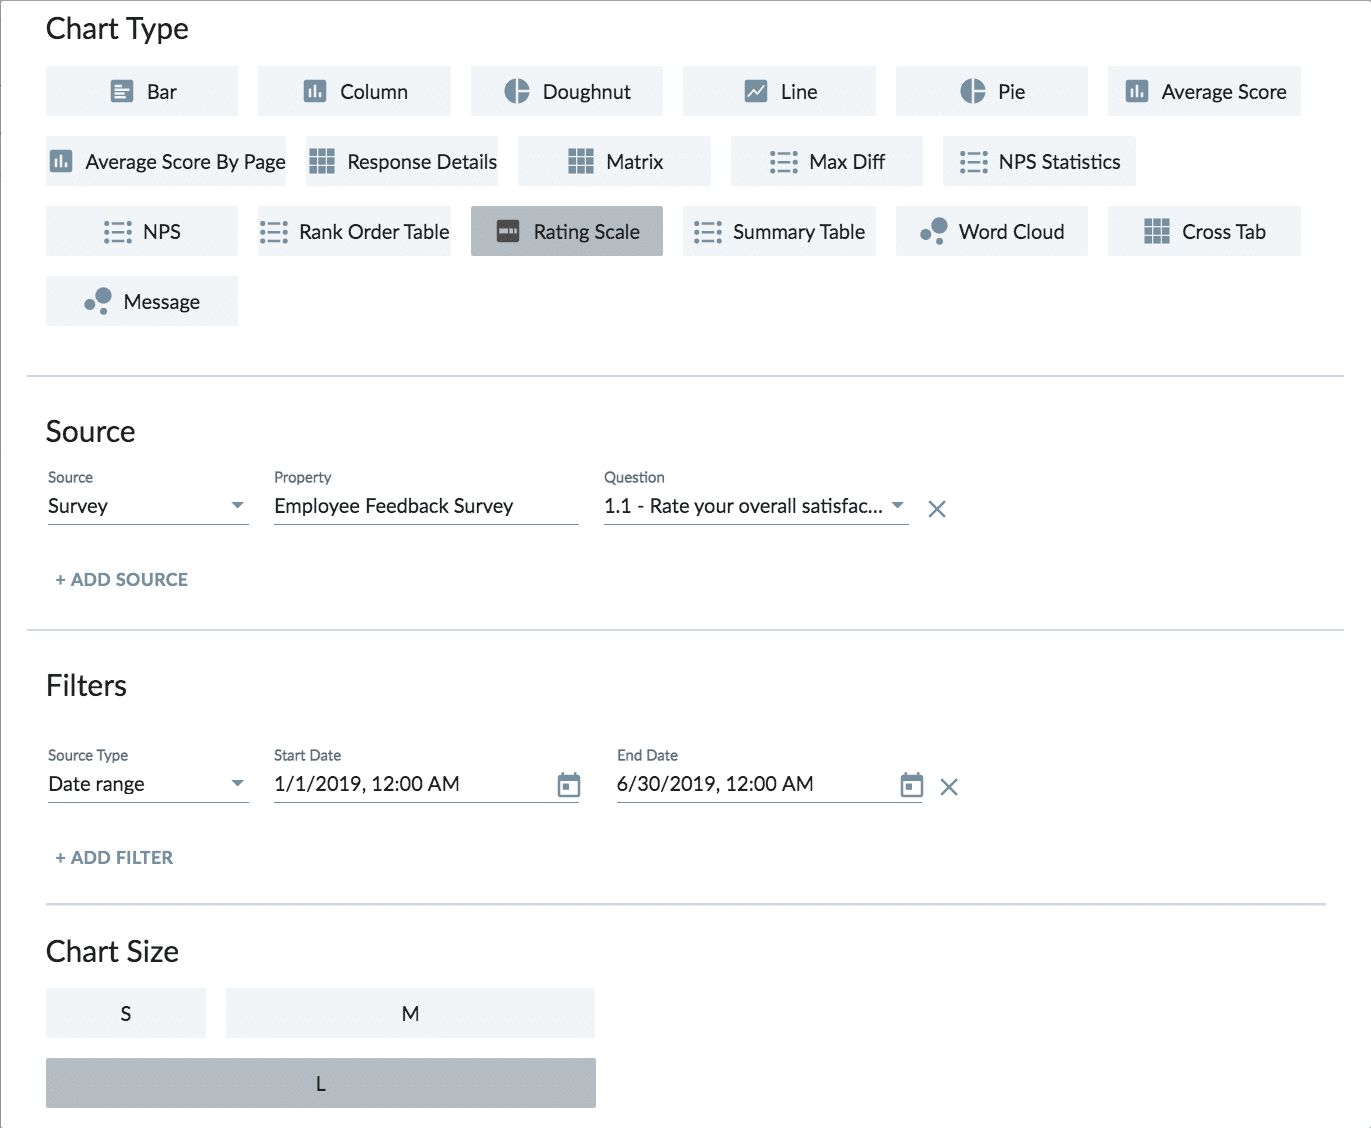
4. Choose the options for your Chart
- Give your chart a name. This is optional and will be shown in addition to the survey name/question text. - Choose the chart type, e.g. bar, column, line. (Note that certain chart types will only work for certain question types. For instance, the Matrix table will only be available for matrix questions). - Choose the Source, which will be the Survey Name and Survey question. (*Hint: if you start typing the name of your survey under Property, it will autofill.) - Add an optional Filter if you'd like to report on a subset of your data, such as responses collected in a certain date range. (Note that Filters added to your chart will only apply to that one chart.) - Choose your Chart Size. Small charts take up 1/3 the page width, Medium 2/3 the page width, and Large the full page width. 
5. Continue adding Pages and charts to your Dashboard until it's just the way you want it.
Note that Dashboards are yours to customize - you can include as few or as many pages and charts as you want. You can also include charts for one survey or several. Dashboards can be modified at any time.

0 Comments