View/Export Responses and Run Reports
1. View or Export Responses (your raw survey data)
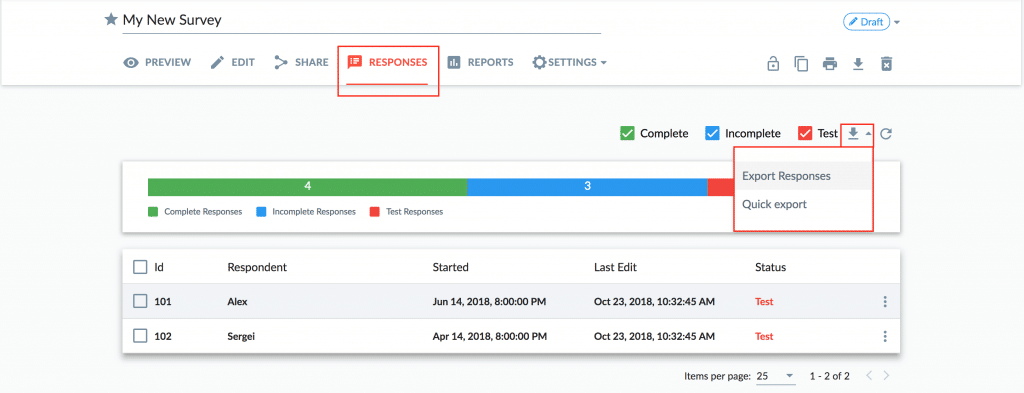
- Go to the Responses tab of your survey to view and edit individual responses. Use the Complete/Incomplete/Test filter options to control which responses appear for you.
- Click the Export icon to export your response data.
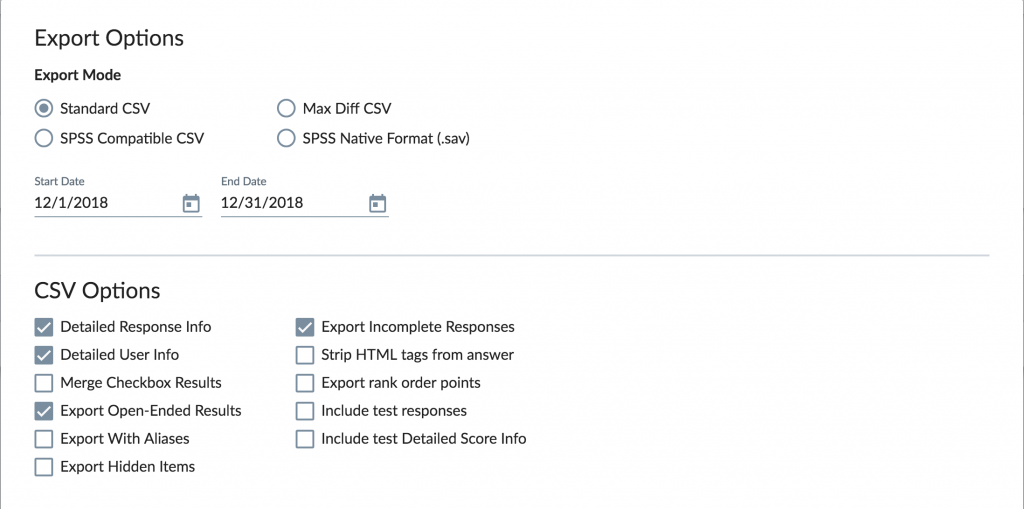
- The Export Responses option will allow you to choose to export to .csv or .sav, and choose what information to export.
- Quick Export is a one-click response export based on the defaults you set up in your System Settings.
2. View your standard Report
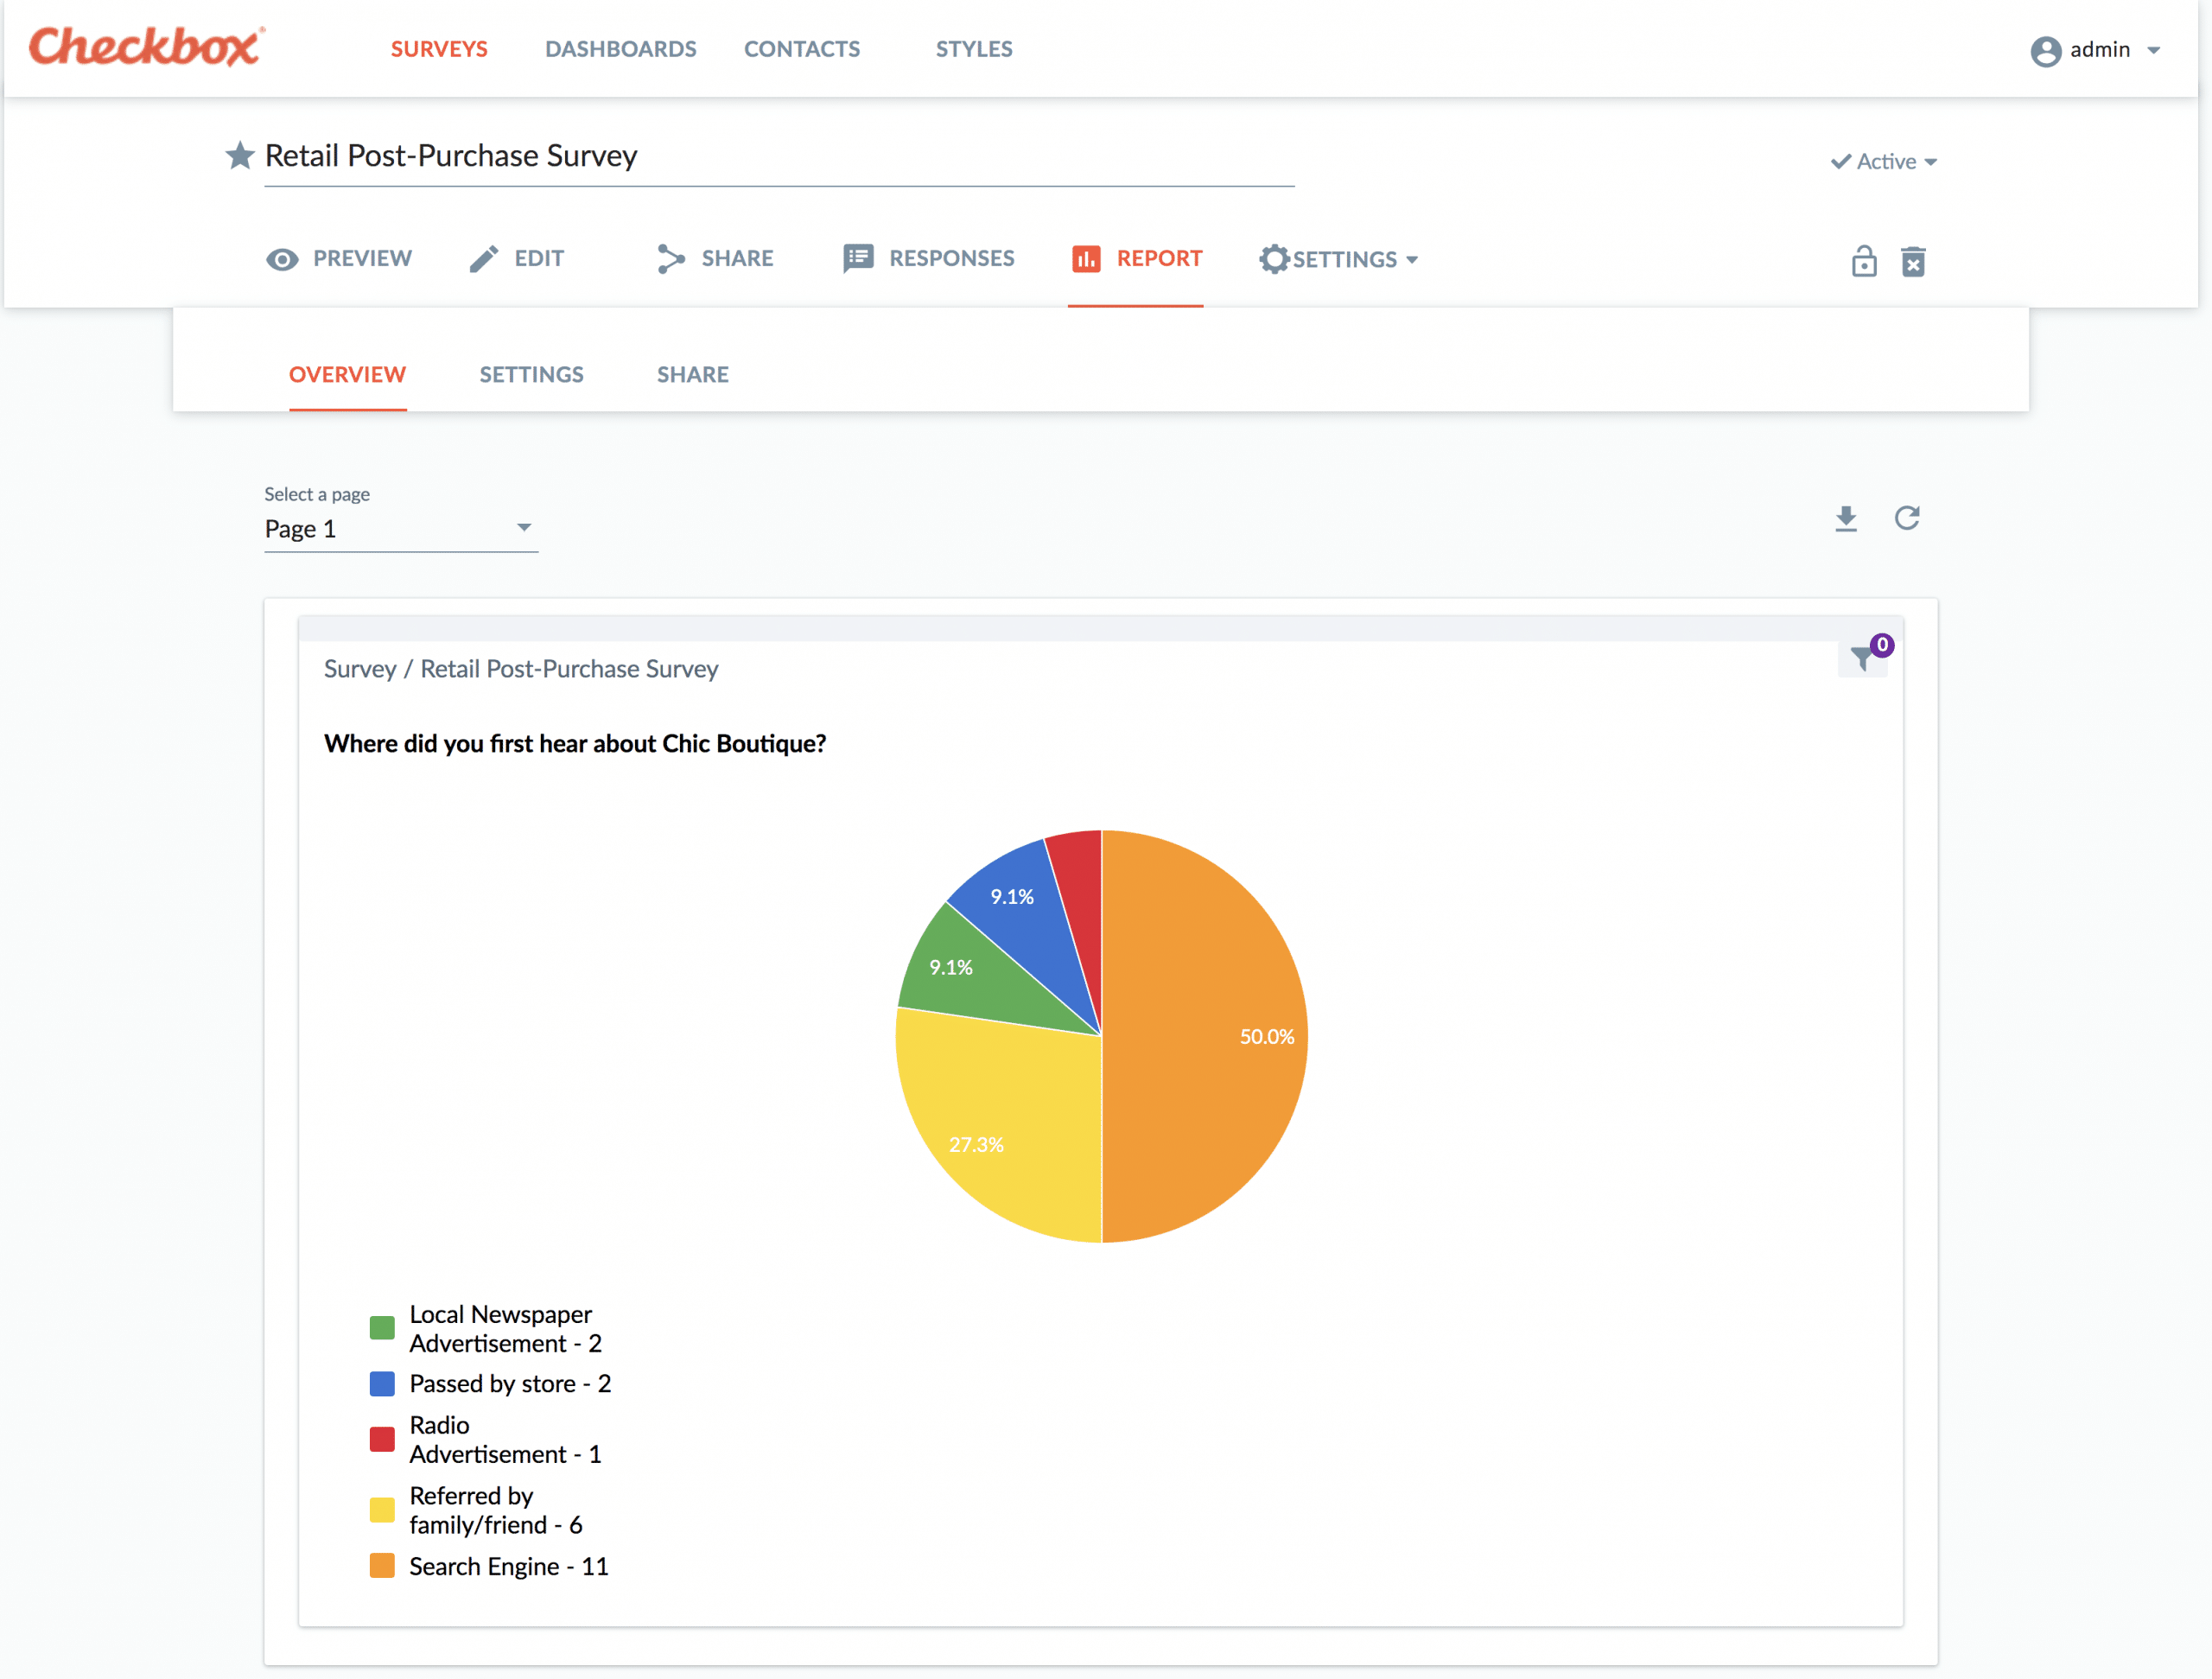
- From within your survey editor, click the Report tab to view your pre-made standard report
- Your Report will include default chart types for each question of your survey.
- The report can be exported using the export icon, or shared via link on the Sharing tab
3. Create & Run Custom Dashboards (reports)
- To create a more custom report or a report based on multiple surveys, you will want to use the Dashboards feature.
- Go to the main Dashboards menu to create a new custom report.
- Click Create Dashboard
- Click Add a New Page then Add Dashboard Item
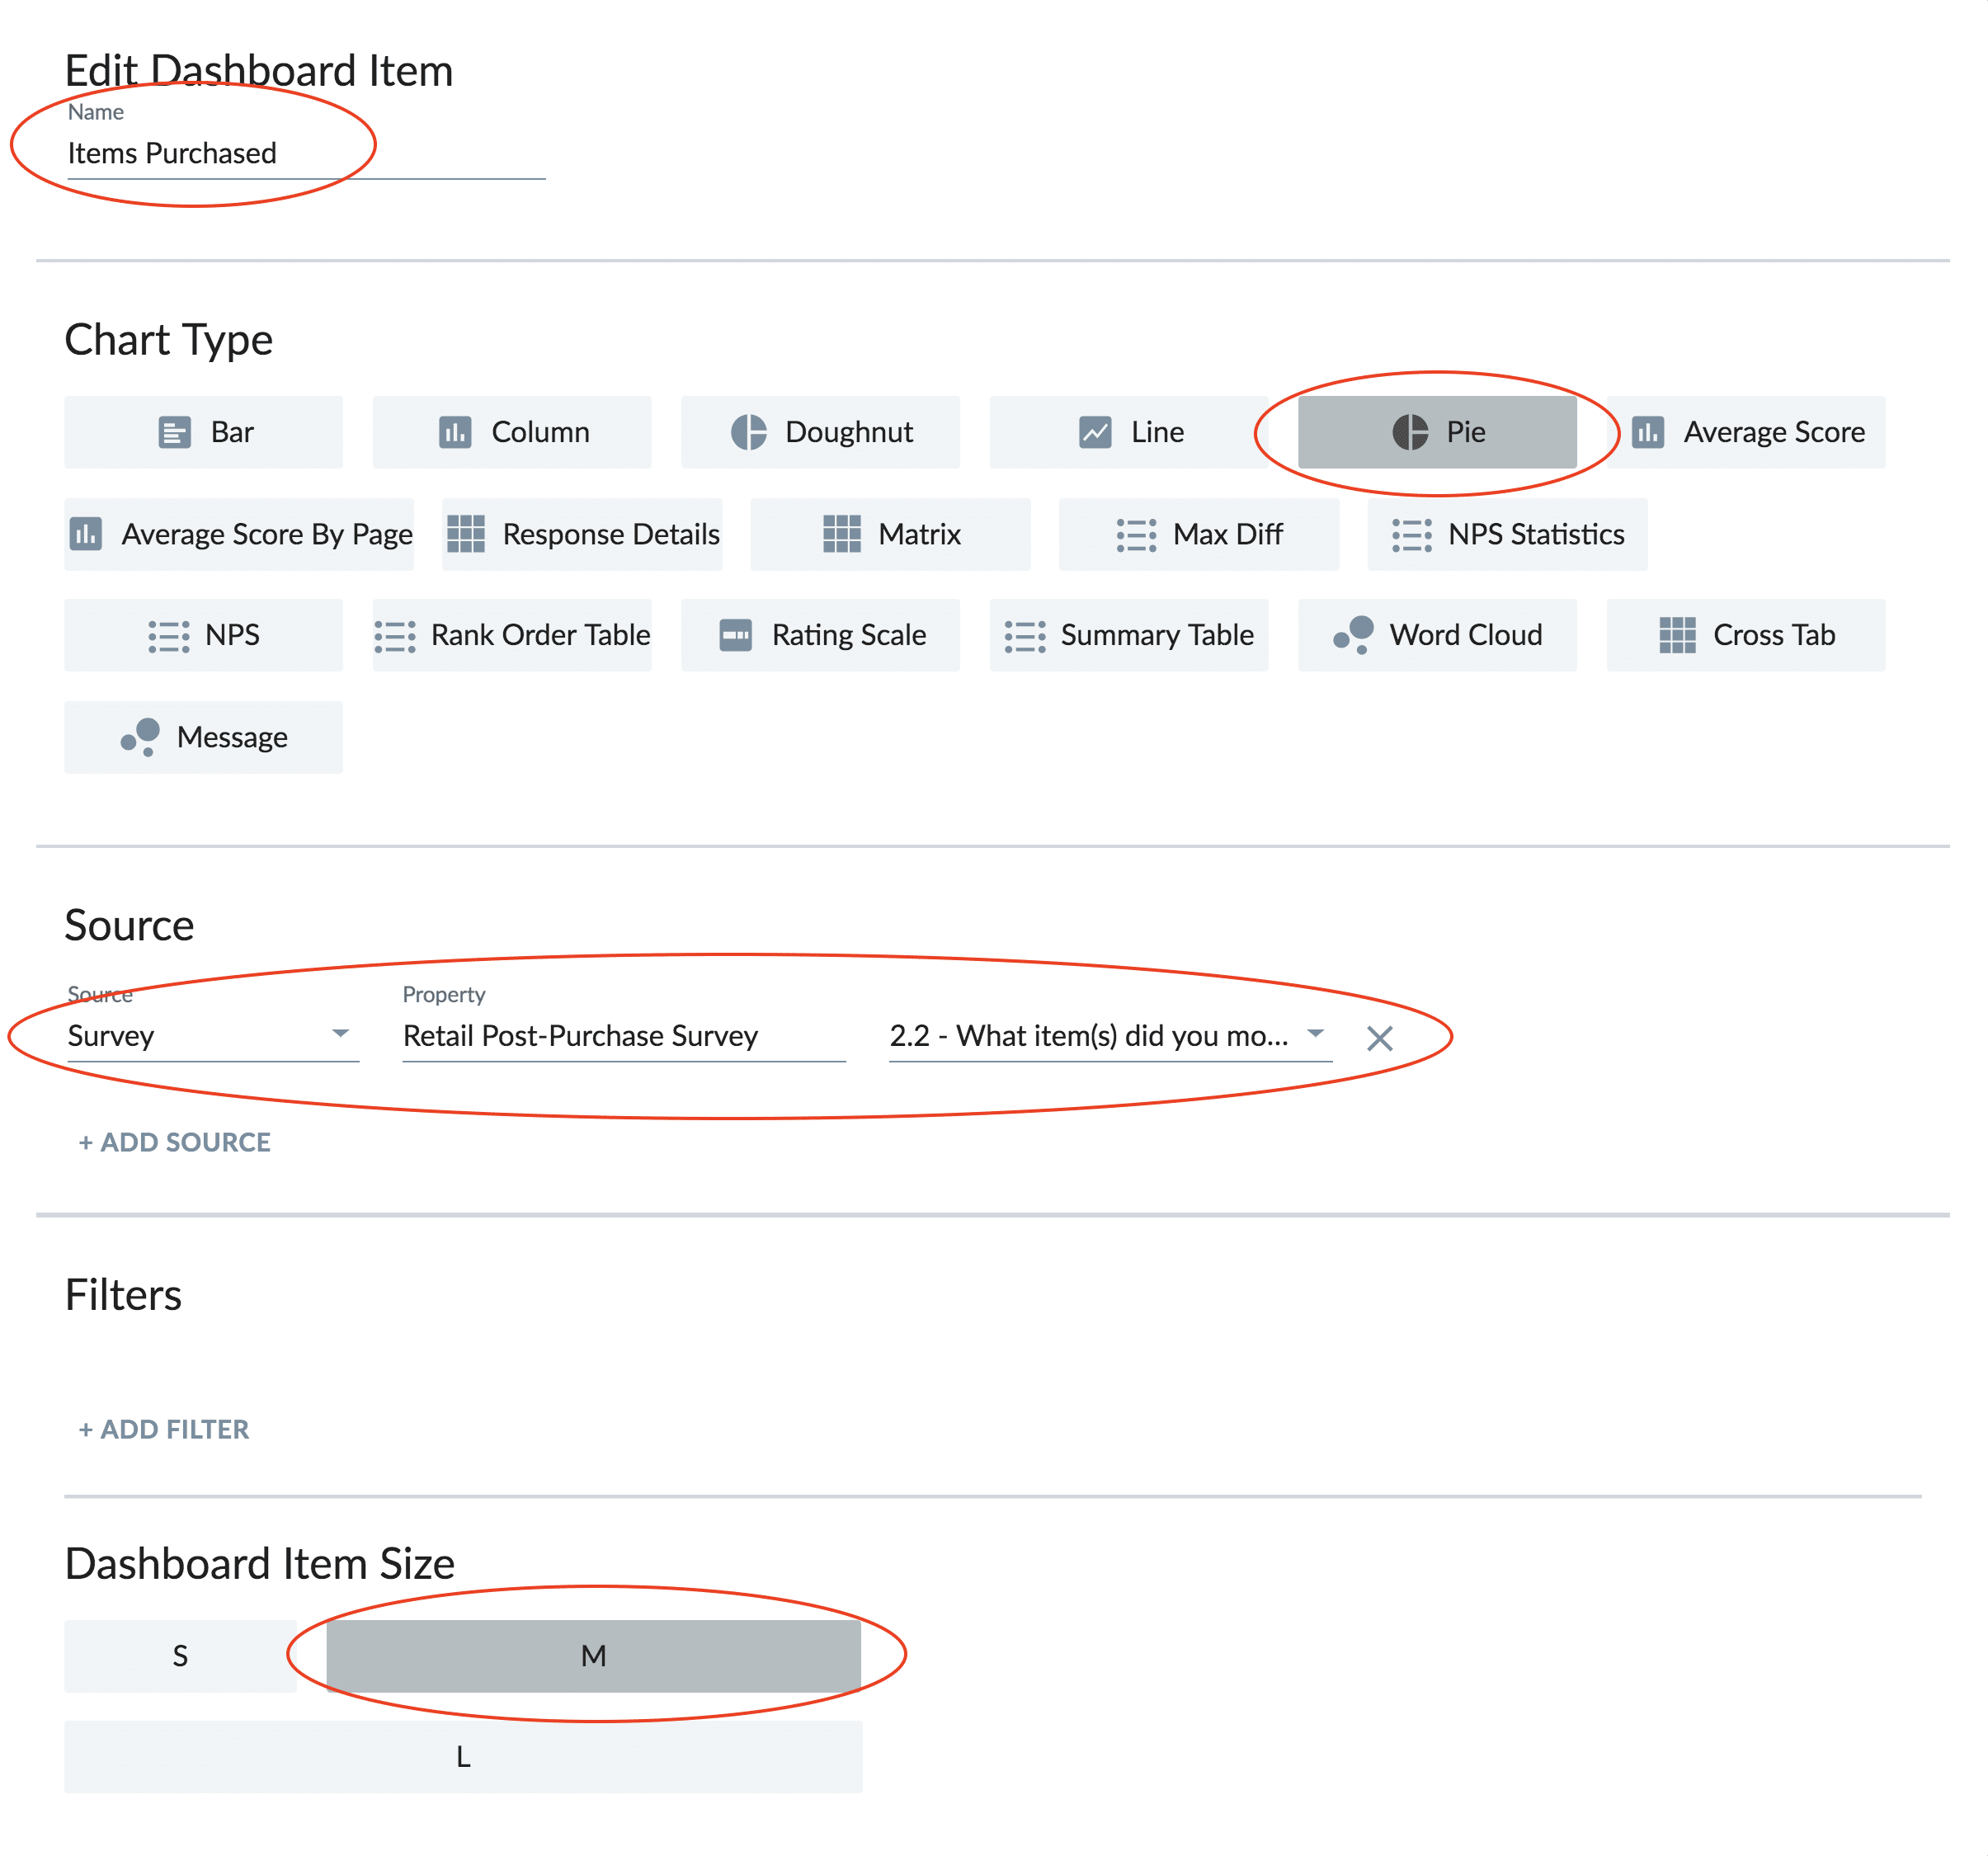
- Choose your dashboard item options 1) Name (optional), 2) Chart Type, 3) Survey and Question Source, 4) Report Filter (optional), and 5) Size
- Click Add
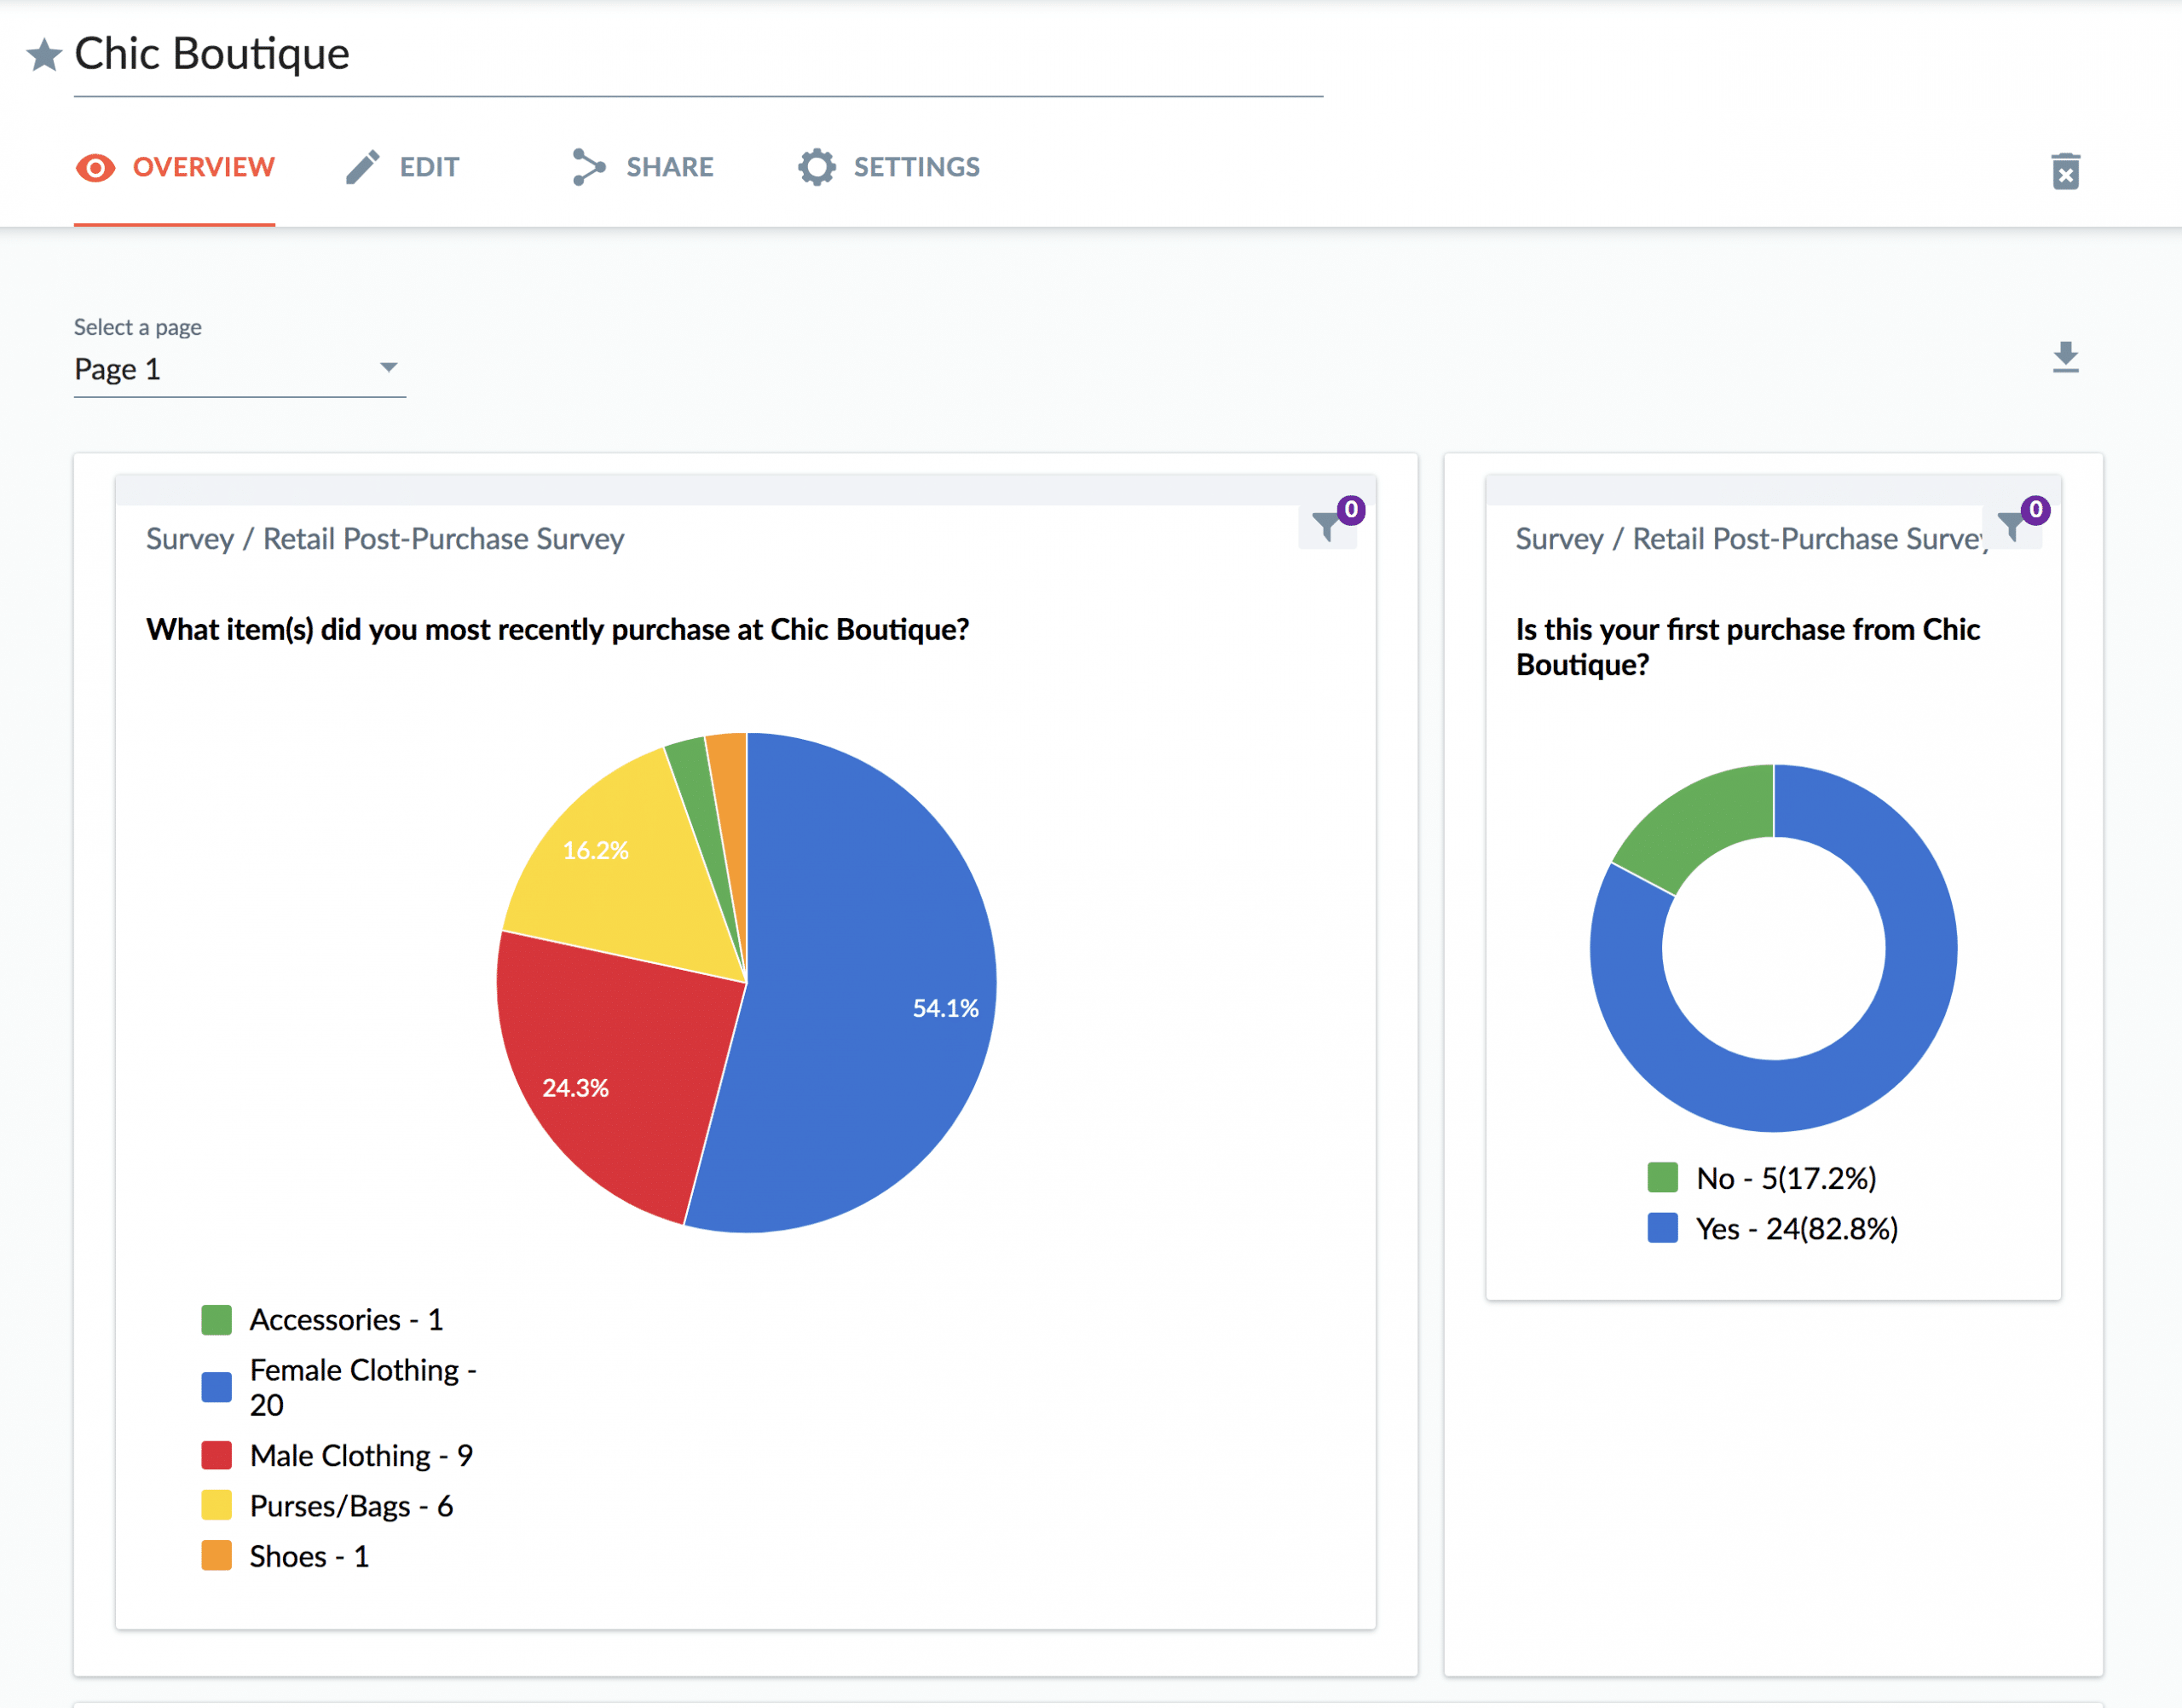
- Once you are done adding your charts, click the Overview tab to view your results

0 Comments